Hi! I'm Jonas Schöley, PhD, Demographer interested in mortality, uncertainty, dataviz, statistical computing. Research Scientist at MPIDR.
Below you can see what I've been up to:
Event • Oct 9, 2025
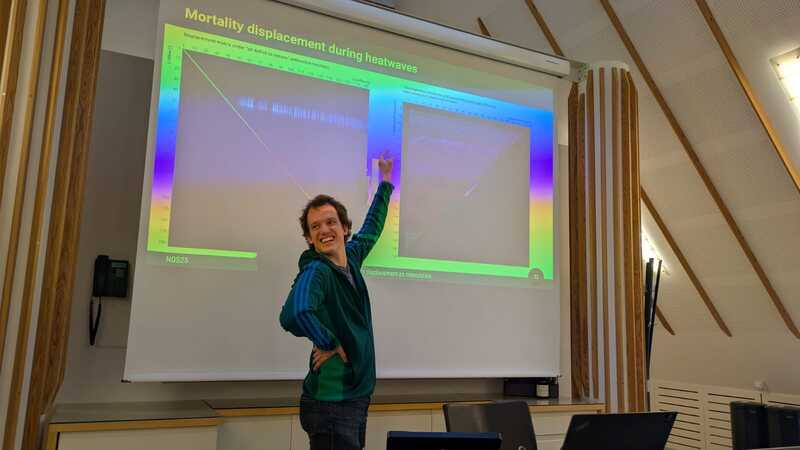
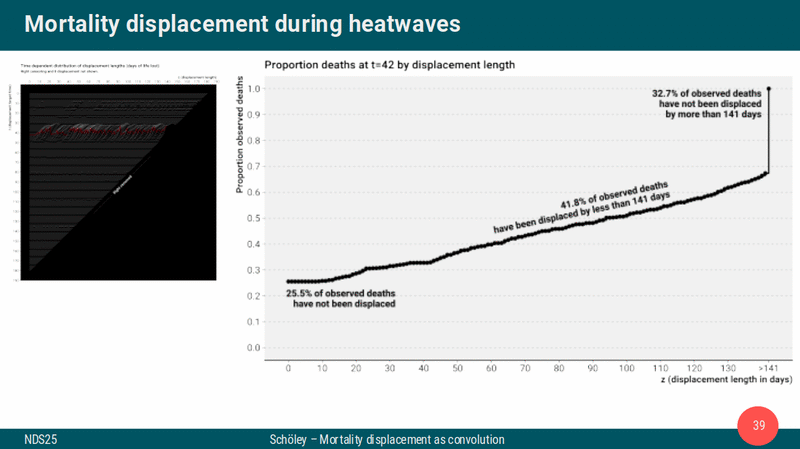
Event • Sep 24, 2025
Publication • Aug 1, 2025
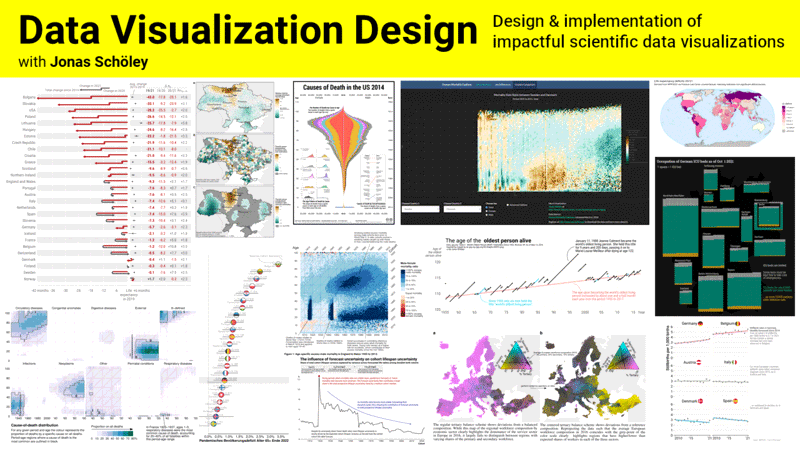
Teaching • Jun 23, 2025
Publication • Jun 20, 2025
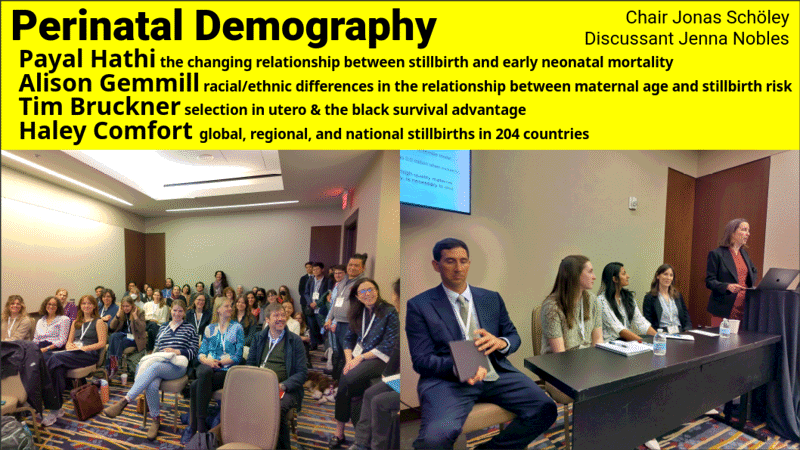
Event • Jun 12, 2025
Event • Jun 11, 2025
Software • May 20, 2025
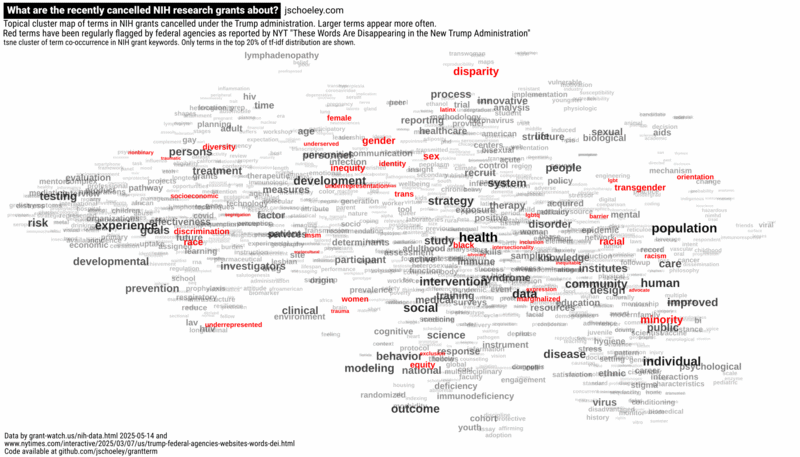
Blog • May 14, 2025
Event • Apr 12, 2025
Media • Apr 3, 2025

Event • Mar 17, 2025
Media • Mar 11, 2025

Teaching • Mar 1, 2025
Media • Feb 4, 2025

Publication • Jan 21, 2025
Publication • Dec 11, 2024
Teaching • Nov 1, 2024
Publication • Sep 27, 2024
Event • Sep 26, 2024
Media • May 22, 2024

Software • May 1, 2024

Event • Mar 1, 2024

Teaching • Mar 1, 2024
Media • Jan 10, 2024

Software • Jan 1, 2024

Teaching • Nov 22, 2023
Media • Aug 10, 2023

Publication • Jul 24, 2023
Media • Jun 20, 2023

Media • Mar 23, 2023
Publication • Feb 28, 2023
Publication • Feb 11, 2023
Media • Feb 1, 2023

Media • Jan 31, 2023

Teaching • Nov 30, 2022
Media • Oct 18, 2022

Publication • Oct 17, 2022
Publication • Oct 13, 2022
Teaching • Jun 17, 2022
Teaching • Apr 1, 2022
Publication • Sep 26, 2021
Publication • Jun 9, 2021
Publication • Mar 9, 2021
Publication • Jan 19, 2021
Publication • Nov 19, 2019
Publication • May 1, 2019
Blog • Feb 13, 2019

Media • Nov 10, 2018

Publication • Sep 20, 2018
Blog • Jul 31, 2018
Media • Jul 24, 2018

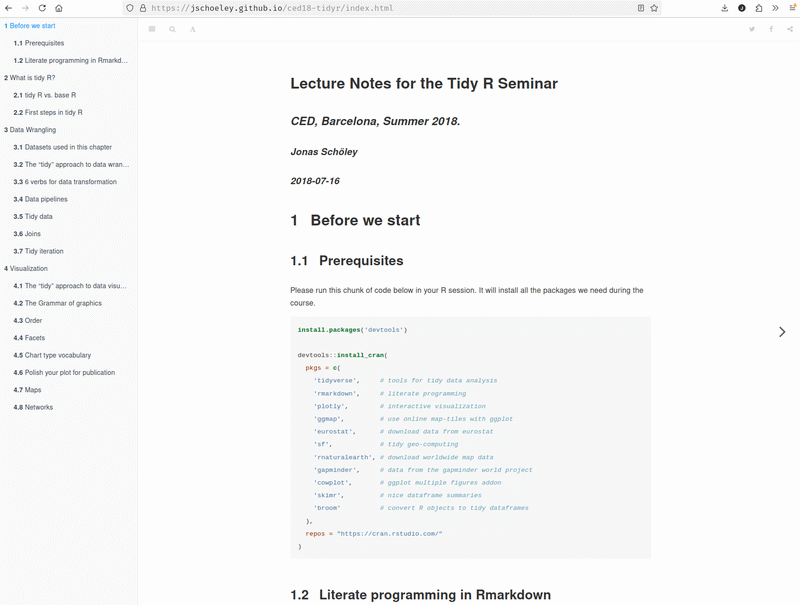
Teaching • Jul 15, 2018
Blog • Jul 3, 2018
Blog • Jun 30, 2018
Teaching • Jan 29, 2018
Publication • Aug 22, 2017
Blog • Jun 28, 2017
Publication • Feb 17, 2017
Teaching • Apr 7, 2016
Blog • Jan 29, 2016
Blog • Jan 8, 2016
Blog • Oct 15, 2015
Blog • Sep 9, 2015
Blog • Sep 7, 2015
Blog • Aug 12, 2015
Blog • Jul 7, 2015
Blog • Jun 12, 2015
Media • Jun 11, 2015

Blog • May 5, 2015

Blog • May 5, 2015

Blog • Apr 27, 2015
Blog • Apr 27, 2015

Blog • Oct 17, 2014

Blog • Jan 15, 2014

Blog • Dec 27, 2013
Blog • Jul 24, 2013
Blog • Jun 11, 2013
Blog • Jun 9, 2013

Blog • Jun 7, 2013

Blog • Aug 21, 2012

Blog • Apr 13, 2012

Blog • Mar 24, 2012
Blog • Jan 19, 2012
Blog • Jan 15, 2012
Blog • Sep 22, 2011
Blog • Apr 29, 2011

Blog • Mar 17, 2011